Why I ran the tests
This site is built as plain, pre-made pages with no database and no third-party scripts, so I expected it to be quick. Expecting is not the same as knowing, so I ran it through three free tools on 22 November 2026 and kept the evidence. This article walks through what they showed, and what I think a good score does and does not tell you.
The tools I used
- PageSpeed Insights runs Google’s Lighthouse test. It scores performance, accessibility, best practices and SEO out of 100, and shows real-visitor data too once a site has enough traffic.
- GTmetrix runs a similar lab test and adds a loading waterfall and a grade.
- Pingdom gives a simple timing and size breakdown of every file the page loads.
A lab test loads your page once in a controlled setting. It is a useful health check, but it is not the same as what your visitors experience on their own phones and connections.
The three measures worth knowing
Google groups the measures it treats as most important for user experience as Core Web Vitals. For a page to count as “good”, Google looks at the 75th percentile of real visits, which means the experience of all but the slowest quarter of visitors.
| Measure | What it tells you | “Good” threshold |
|---|---|---|
| Largest Contentful Paint (LCP) | How long until the biggest thing on the screen appears | 2.5 seconds or less |
| Interaction to Next Paint (INP) | How quickly the page responds when you tap or click | 200 milliseconds or less |
| Cumulative Layout Shift (CLS) | How much the page jumps around while loading | 0.1 or less |
Interaction to Next Paint replaced First Input Delay as the responsiveness measure in March 2024. Lab tests cannot measure it directly because nobody is tapping the page, so they report Total Blocking Time instead, which is a stand-in for how busy the browser is.
My results
PageSpeed Insights, mobile test of the home page
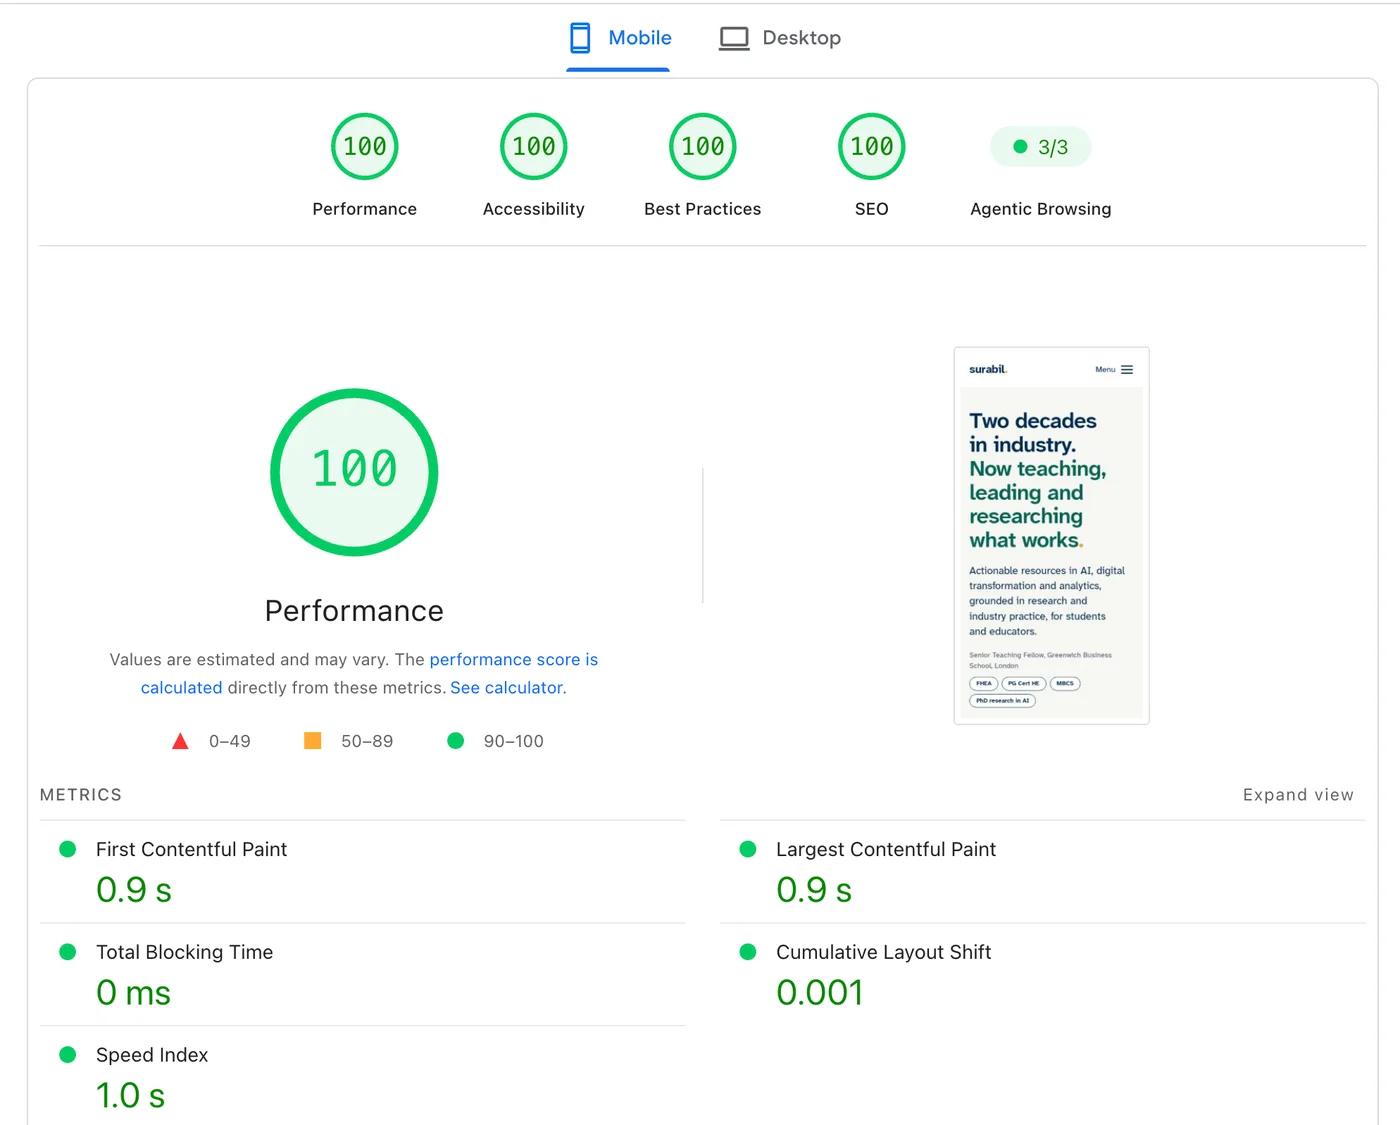
The home page scored 100 in all four categories on a mobile test. Loading measures were 0.9 seconds for both first and largest paint, no blocking time, a layout shift of 0.001 and a Speed Index of 1.0 seconds.
That test was deliberately tough. It emulated a mid-range Android phone (a Moto G Power) on a throttled slow 4G connection, so it is closer to a modest phone on a weak signal than to a laptop on fibre.
| Measure | My result | Good threshold |
|---|---|---|
| Largest Contentful Paint | 0.9 s | 2.5 s or less |
| Total Blocking Time (stand-in for INP) | 0 ms | not a Core Web Vital |
| Cumulative Layout Shift | 0.001 | 0.1 or less |
Pingdom, which loads the page from a London server, reported the content loaded in about 230 milliseconds and everything finished in about 280 milliseconds. In that test the whole home page was seven requests and roughly 90 KB.
What made it fast
Nothing here is clever. It is mostly the absence of things.
- Pre-built pages. The site is generated ahead of time, so a visitor is sent a ready-made file, with no database lookup and no page being assembled on request.
- One small stylesheet. About 12 KB after compression, rather than a pile of plugin styles.
- Fonts from my own domain. The font files are about 24 KB each and come from my own site, with no request to an outside font service.
- No third-party scripts. No trackers, widgets or embedded tools, so the browser has no other servers to wait for.
- A compressed portrait. My photo is a 12 KB WebP image, converted from a much larger original. I explain the steps in my guide to shrinking images for the web.
- A fast delivery network. Cloudflare serves the files from a server near the visitor, and every file in my Pingdom test came from its cache.
None of this needs special skill. It comes from deciding early that each addition has to earn its place.
What the red triangles meant
Even a 100 comes with a few red warning triangles in the detailed view. They are marked “Unscored”, which means they do not change the score, and it is worth knowing how to read them.
Lighthouse advisory: render-blocking requests
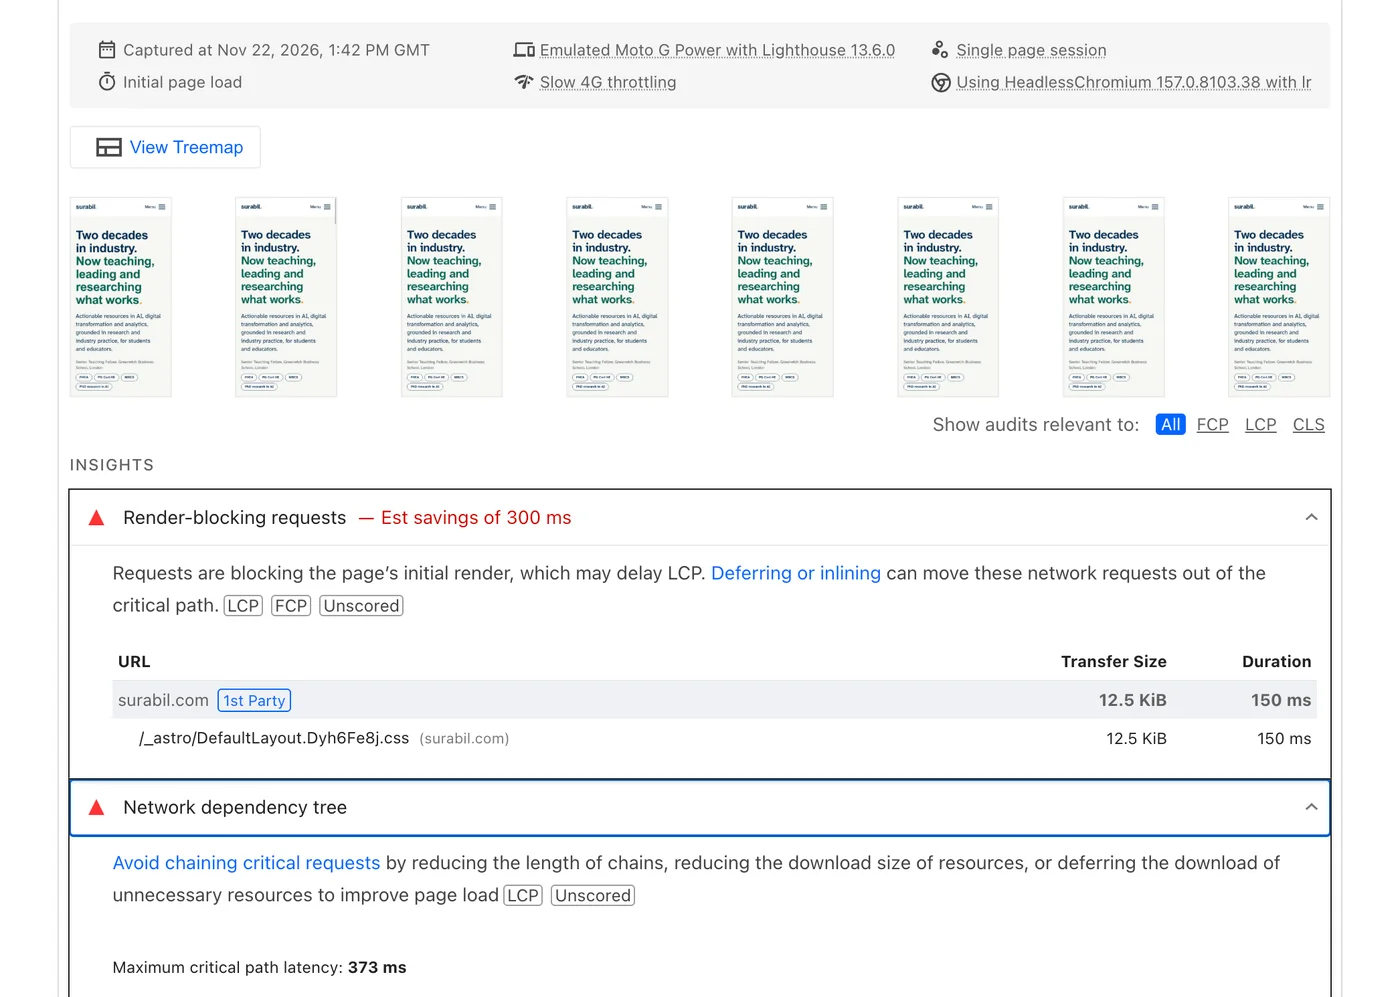
Lighthouse flags the single 12.5 KB stylesheet as render-blocking, with an estimated saving of 300 milliseconds. It is marked unscored, so it does not affect the 100.
The stylesheet is “render-blocking” because the browser waits for it before painting, which is normal and sensible. Without it the page would flash unstyled. For one small file served from nearby, moving it elsewhere would save almost nothing in practice.
Lighthouse advisory: network dependency tree
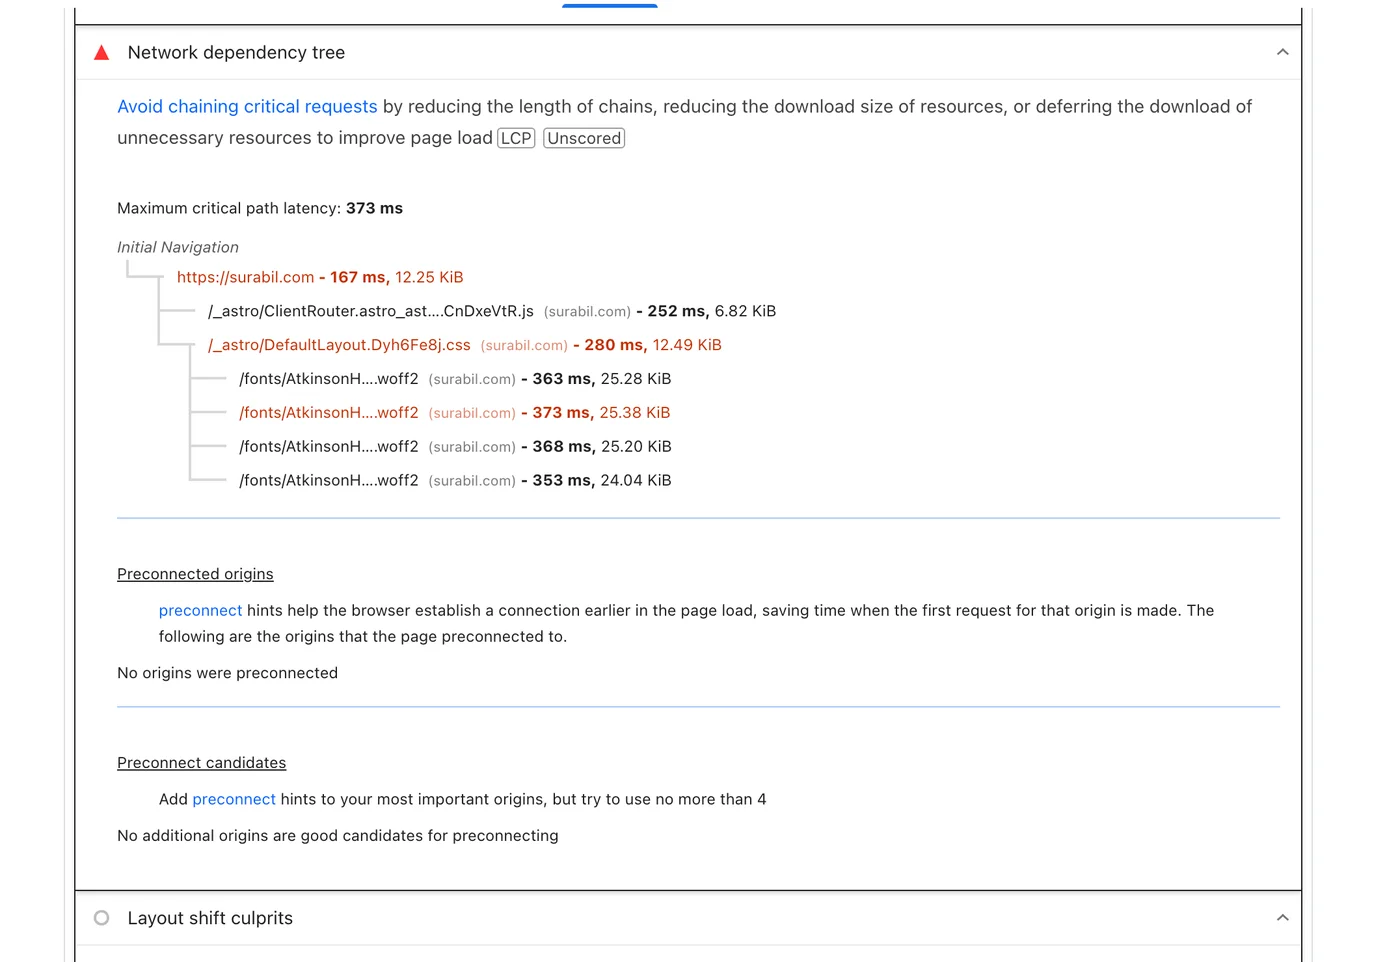
The page loads first, then a script and the stylesheet, and the stylesheet then asks for the font files. The longest chain takes 373 milliseconds, and every file comes from my own domain.
The dependency tree shows files that wait on other files. Here the chain is short: page, then stylesheet, then fonts. The fonts also explain the only layout shift, a tiny 0.001 movement of one full stop and one badge when the font arrives. That is far below the 0.1 limit and not something a visitor would notice.
What a perfect score does not tell you
I do not want to overstate this.
- A simple site is an easy case. This site has text, a few images and no shop, no booking system and no video. Sites with more to do will score lower, and that is often a fair trade for what they offer. I explain why I chose a static site for this one in the good, the bad and the ugly of WordPress.
- A lab score is a snapshot. PageSpeed Insights reported no real-visitor data for my site yet, which is normal for a new one. Google builds that picture over time from actual visits.
- A score is not the goal. Chasing 100 on a page that does real work can make it worse for the people using it. Speed matters because it makes a page easier to use, and a score only hints at that.
- Search benefit is modest. Page experience is one signal among many, and content that answers the question matters far more.
If you want to do this on your own site
- Test your most important pages, not only the home page, and do it on the mobile setting first.
- Run each test twice, because the first run can hit a cold cache.
- Fix the biggest items first, which are usually large images, heavy scripts and outside services. Start with image size and format.
- Re-test after every change so you know what helped.
- Keep a note of the date, because results will drift as your site and the tools change.
For the wider habits behind a site people enjoy using, see tips to improve your website’s user experience.
Sources
- How the Core Web Vitals metrics thresholds were defined, web.dev
- Core Web Vitals report, Google Search Console Help
- What are Core Web Vitals and how to improve them, Ahrefs (LCP, INP and CLS thresholds, and INP replacing First Input Delay in March 2024)
- My own PageSpeed Insights (Lighthouse 13.6.0, emulated Moto G Power, slow 4G) and Pingdom results for surabil.com, 22 November 2026